HAVE NEGATIVE SHORT TERM INTEREST RATES SET BY SOME CENTRAL BANKS BEEN BENEFICIAL TO THEIR ECONOMIES? AND, PARTICULARLY IN EUROPE, WILL THEY YIELD THE EXPECTED RESULTS?
As the new ECB Chairwoman Mme Christine Lagarde, prepares to comprehensively review the monetary policy position, no one expects any normalization process to begin any time soon, but the ECB is seemingly well aware of the side effects negative rates have on the economy.
And not only the pressure they apply on banks...
| Download the pdf |
QE OR NOT QE IS INDEED THE QUESTION OR IS IT
Long time readers and followers know quite well that one of our main point of interest in the financial markets is liquidity And especially the very important issue of the liquidity provided to the financial systems by the Central Banks I have written at length on these subjects in various articles :
ZOMBIE APOCALYPSE LOOMING? (June 2019) Download the study
Or as recently as mid October after the Repo rates September spikes :
FROM REPO TO QE... (octobre 2019) Download the study
And even in an older one :
The liquidity Problem 2nd part (octobre 2018) Download the study
| Download the pdf |

The expression «Zombie Company » was popularised by Ricardo Cabarello Takeo Hoschi and Anil K Kashya in a 2008 article (American Economic Review on Japan « Lost Decade », the great stagnation 1990 2000.
Zombies companies are defined as ::“Firms that are unable to cover Debt servicing costs from current profits over an extended period” The period of time can vary, the BIS used 3 years in its large definition for example.
And it’s quite possible to narrow the samples by using stricter criteria like the firm must be more than 10 years old for instance This allows us to exclude start ups (like We Work or Uber for instance).
It is this BIS large definition that we shall mainly use.
| Download the pdf |

HOW THE FED FINALLY TOOK BACK CONTROL OF THEIR BENCHMARK INTEREST RATES!
It seems that during the week of the 16 th of September, the Fed’s tightening policy finally started to play through the US financial system.
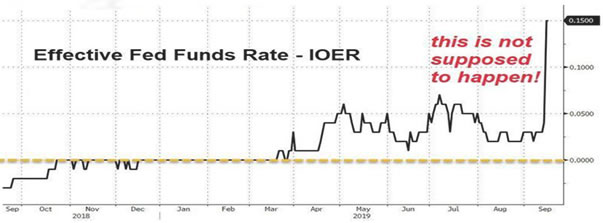
source Zero Hedge
The IOER is the Interest rate that the FED pay on Excess reserves that the banks have got on the Fed books. In this article, we shall give you an account of what happened the week of the 16 th of September, why it happened and what were the various responses of the Federal Reserve And we shall look at how things should normalize going forward for this other liquidity problem to finally disappear.
| Download the pdf |

The beginning of the great unwind or just another Tantrum ???
The week of the 9th of September was a very eventful one on the global financial markets. Although you would not suspect anything major happened in the US equity markets for instance - the SP 500 was up barely 1% on the week - things were far more dramatic under the surface. Indeed what was the biggest weekly rise in the US 10 years yield since 2016 US election day, triggered a massive unwinding of the Growth to Value trade. We will take a deep and thorough look at what actually happened during this week, to assess whether it was a one off event or the beginning of the long awaited (by some at least) Growth to Value shift.
| Download the pdf |
Following Michael BURRY’s i nterview (Bloomberg via email) on September the 4 th 2019 in which he establishes a parallel between a bubble that he sees developping in the index funds and the subprime CDOs bubble,(main cause of the Great Financial Crisis of 2008 it seems like a good time to review the index funds and their liquidity
Following Michael BURRY’s i nterview (Bloomberg via email) on September the 4 th 2019 in which he establishes a parallel between a bubble that he sees developping in the index funds and the subprime CDOs bubble,(main cause of the Great Financial Crisis of 2008 it seems like a good time to review the index funds and their liquidity

As discussed in the conclusion of my previous article about the almost incredible first half rally in virtually every single asset class, during the second quarter of 2019, an ever growing divergence between bonds and equities started to be visible. With the parabolic rally in bonds prices towards the end of June, it reached epic proportions, as you can see with Chart 1 below.
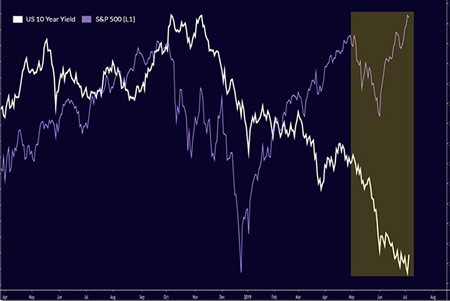

If you had left on Xmas day 2018 for a 6 months space trip and came back to earth at the end of June 2019, it would have been hard to believe how well things had gone for the financial markets during your absence.
Especially if you remember the “Doom and Gloom” atmosphere which prevailed at the end of 2018!
As we are still in early July, it seems to us that it is a good time to comment on what happened during the first half of 2019.
Thanks, essentially to the Federal Reserve and the other major Central Banks pivoting decisively back towards accommodative policy, as early as mid- January, assets of all stripes have rallied this year.

The term “ZOMBIE” has been put back on the front pages recently, mainly because of the last Jim Jarmush’s movie: “The Dead don’t die” which was presented during the opening ceremony of the last Cannes film festival. In this hilarious comedy Jarmush revisits the so called “Zombies movies” of the 60’s and 70’s. A funny and intelligent homage to the old masters like G. Romero (See picture below). A few months before, the BIS released a report that the public probably never heard about:
“THE RISE OF ZOMBIE FIRMS: CAUSES AND CONSEQUENCES”
In this very interesting article, the co-authors ask three essential questions: 1/ Is the worldwide increase in the number of zombie firms episodic? 2/ What are the causes of the rise of zombie firms? 3/ What are the economic consequences of the rise of zombie firms? This, mainly, academic report triggered a lot of debate and a flurry of private research firms detailed articles. What we propose to do here is to offer you a synthetic view of this issue.
The seriousness of this issue having been emphasized very recently, by the near-bankruptcies of Rallye in France, Bristish Steel in the UK and the collapse of the Tesla share price in the US, all three events taking place during the last 10 days of May…

A TEXTBOOK CASE OF SELL IN MAY AND GO AWAY? OR THE FIRST SIGN OF SOMETHING MORE SINISTER? ANOTHER EXAMPLE OF THE EVER GROWING IMPORTANCE OF POLITICAL TWEETS …
Following what has been the best start of the year for many asset classes, especially for US equities as a whole which had their best January to April period since 1992, the main US equity index, the SP500, reached a new historic high (2954) on the 1st of May 2019. And just when everything started to look nice and rosy again for investors across the world, a couple of 180 characters tweets by arguably the most powerful man on the planet triggered an avalanche of equities sales worldwide. We then decided to take a deep and thorough look at what actually happened in the Equities markets, to assess whether it was a textbook case of the famous Wall Street adage: Sell in May and go away. Selloffs following record highs are usually fierce and should probably be viewed as some semblance of cathartic, particularly after 4 months of relentless upward move. As we stated in a former study (October CTA and HF catastrophe explained): drawdowns are generally seen as offensive these days. Sell in May and go away?

PART V: CREDIT MARKETS
Following the comprehensive and thorough review of the equities volatility markets (Part I) Commodities volatility (Part II), Currencies (Part III) and Emerging markets volatility (Part IV) in 2018, we shall now focus on the volatilities behavior of some of the main credit markets. Obviously we’ll review some of the most important sovereign debts (USA, Germany and Italy) but we shall consider the volatility of one of the biggest US Corporate IG ETF, before completing this study with the volatility of the biggest US High Yield ETF. For every single one of these markets we shall study their prices evolution and the consequences that these evolutions had on their volatilities, implicit and historical. And we’ll try to explain the rational (or not) reasons which led these markets to move the way they did in 2018. And finally we will exhibit some conclusions which were not necessarily expected. As indicated we shall start with the biggest and most liquid sovereign debt market in the world: the US Treasuries and more specifically the 10 years T-Note. A brand new chapter which could be called : Disappointed hopes of high volatilities
Disappointed hopes of high volatilities.

PART IV: EMERGING MARKETS
After a comprehensive study of the equities (Part I), commodities (Part II) and currencies markets (Part III) volatilities in 2018, we are now going to focus on the volatility of the main emerging markets. Being well aware that emerging markets constitutes a vast universe, we will focus on a small, but in our view representative sample containing several different countries. And we shall study either the stock markets volatilities or the bonds markets volatilities, or both depending on the countries and the interest that they present. But before diving into the various emerging market countries’ specifics, let’s focus on two generic emerging markets stocks and bonds indices:
The ISHARES MSCI EM ETF and the ISHARES JPM EMB Bonds Index.
Where implied volatility data were available, we used them, for others, where there were none, we used the historical volatilities. So let’s start with the ISHARES MSCI EM ETF. Another sad and depressing story (if you were long that is…)
.

PART III: CURRENCIES MARKETS
After a comprehensive study of the equities (Part I) and commodities (Part II) markets volatilities in 2018, we are now going to focus on the volatility of the main currencies. The USD being the reserve currency, and therefore the most traded worldwide, we shall examine the behavior of the volatility of several other currencies priced against the USD. Typically the volatility of the EUR vs the USD (EUR/USD) or the volatility of the so called cable (GBP/USD). As it would be neither convenient nor interesting to study a large number of currencies pairs, we shall reduce the sample of currencies to five different ones: the two most liquid, EUR and JPY, the GBP (ahead of Brexit), the Chinese yuan CNY (in these times of trade war) and the Brazilian Real (BRL) for the emerging markets currencies. We will refrain from talking about the frightening collapse of the Venezuelan Bolivar or the permanent devaluation of the Pakistani rupee as they are small markets in which available volatility data are few and far between. And for each of the five currencies of the chosen sample, we’ll study the evolution of their volatility against the USD, usually the implied volatility as the currencies options markets are very liquid, trying to explain why it moved, or not… And we’ll exhibit some facts that might surprise a few readers. So let’s start with the EUR/USD pair. A story which could be titled:
Please leave the genie in its bottle.
.

PART II: COMMODITIES MARKETS
In this second part of our study of volatilities in 2018, we shall focus on the Commodities markets. Given the fact that there are far too many commodities markets to study, we shall consider only a few of them, the biggest, most liquid and most important ones: Crude Oil, US Natural Gas, and Gold. So we will start this second part with a detailed analysis of the Crude Oil Volatility. And more specifically the WTI (West Texas Intermediate the US benchmark) Volatility.

PART I: EQUITIES MARKETS
The initial idea behind this article was, in fact, to exhibit the various risks and dangers of the so-called crowded trades. And, as at the beginning of 2018 the 2 most overcrowded trades on the planet were Short US Treasuries and even more widespread: short volatility, it became clear that the short vol trade would require a comprehensive study in itself. Specially because of the different behaviors of the volatilities of the different asset classes. So here it is!
Equities Markets Selloff explained
Following what has been the worst month of the year for pretty much all the asset classes, USD Currency apart, the worst month for US equities, as a whole, since 2011, and the worst month for the NASDAQ since the GFC, we decided to take a deeper and more thorough look at what actually happened, in the US Equities markets. This study will exhibit some facts which will help to explain why October 2018 which has been called “Red October” was one of the worst months for CTAs, Risk parity, volatility targeting and Hedge Funds since the great financial crisis (GFC).
| Download the pdf |

The Great Fantasy
In this second article, we shall principally study and analyze what might happen to some other sectors of the financial markets when the next financial crisis strikes, given the current liquidity conditions.
More precisely we shall examine the current state of liquidity in the much bigger and much more important Fixed Income Markets.
| Download the pdf |
Study of the US Equities Markets FLASH CRASHES
In this article, we shall study and analyze the ever-important issue of liquidity in the financial markets. Whether in absolute terms or relative terms, this particular issue is, or should be, paramount for all the players, whether investors, traders, asset managers or speculators.
We will start by studying the last two occurrences of the so-called Flash Crashes in the US Equities Markets.
| Download the pdf |

As you know, 2018 / 2019 / 2020 could prove more difficult for investors than the past years of strong bull market on equity indices. The attached document will help you assess the impact of such significant market events on the performances of our Momentum strategy Hereinafter the document that highlights the historical behaviour of the SEVEN DIVERSIFIED FUND during :
| Download the pdf | ||
| Downloaden Sie das pdf | |
|
| Trasferisca il pdf | |
|
| Descargue el pdf | |
|
The market has a love-hate relationship with chartists. Do they have a useful role to play in current markets? What do all these geometric patterns, like head and shoulders, triangles, rectangles, and so on, actually mean? We will be studying in particular patterns that depict long-term market shifts which give us a better idea of the market's upward and downward cycles.
| Download the pdf |
The leverage effect is often synonymous with the highest potential performance, and simultaneously with a significant increase in risk, which may lead to ruination. In this study, we will determine whether these preconceived notions are correct, and confirm whether the leverage effect is always synonymous with an increase in risk. We will specifically study the leverage effect of futures contracts, which does not involve any borrowing costs.
| Download the pdf |

“On the XXXX database, this fund is in the 1st decile over one year, three years and five years. What about over ten years? It’s impossible to compare – there aren’t enough funds. It’s a huge company, so there’s no risk if it loses value, I won’t get blamed for it... I’m buying it.”
Fund selection is a financial decision, just like buying a share, a bond or any other security. It involves both a real act of decision- making and making an investment. It becomes even more complex if you incorporate due diligence into the selection process.
Beyond the due diligence aspect, which we will not address in this study, selecting a fund requires advanced knowledge of quantitative analysis, because performance alone is only the small, visible tip of an enormous iceberg.
| Download the pdf |

Modern portfolio theory tells us that the return from an asset is simply the remuneration of the risk attached to holding the asset.
Therefore, an asset that is considered risky should yield a higher return than a less risky asset.
Modern portfolio theory, developed in 1952 by the winner of the Nobel Prize in Economic Sciences, Harry Markowitz, today constitutes the academic foundation upon which a great many portfolios of financial assets are built.
| Download the pdf |

Just as the seasons follow a continuous cycle, the markets also have their own rhythm. To take advantage of this, we must know how to pinpoint the hidden, recurring patterns that give us a major insight into the possible different ways in future to capitalise on the likelihood that events will occur.
We have therefore observed major patterns without seeking to ascertain, in this study, whether there could be a rational economic explanation behind this market behaviour.
| Download the pdf |
| Download the pdf |
| Download the pdf |